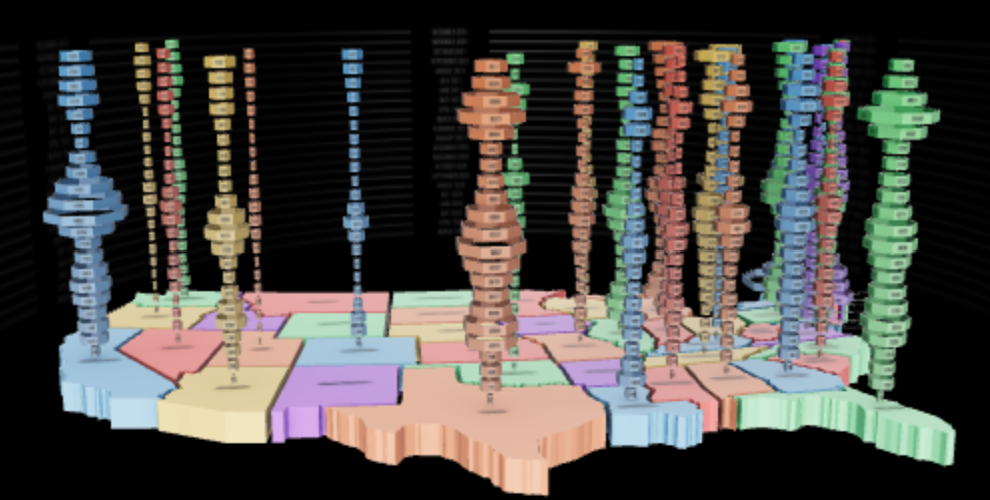
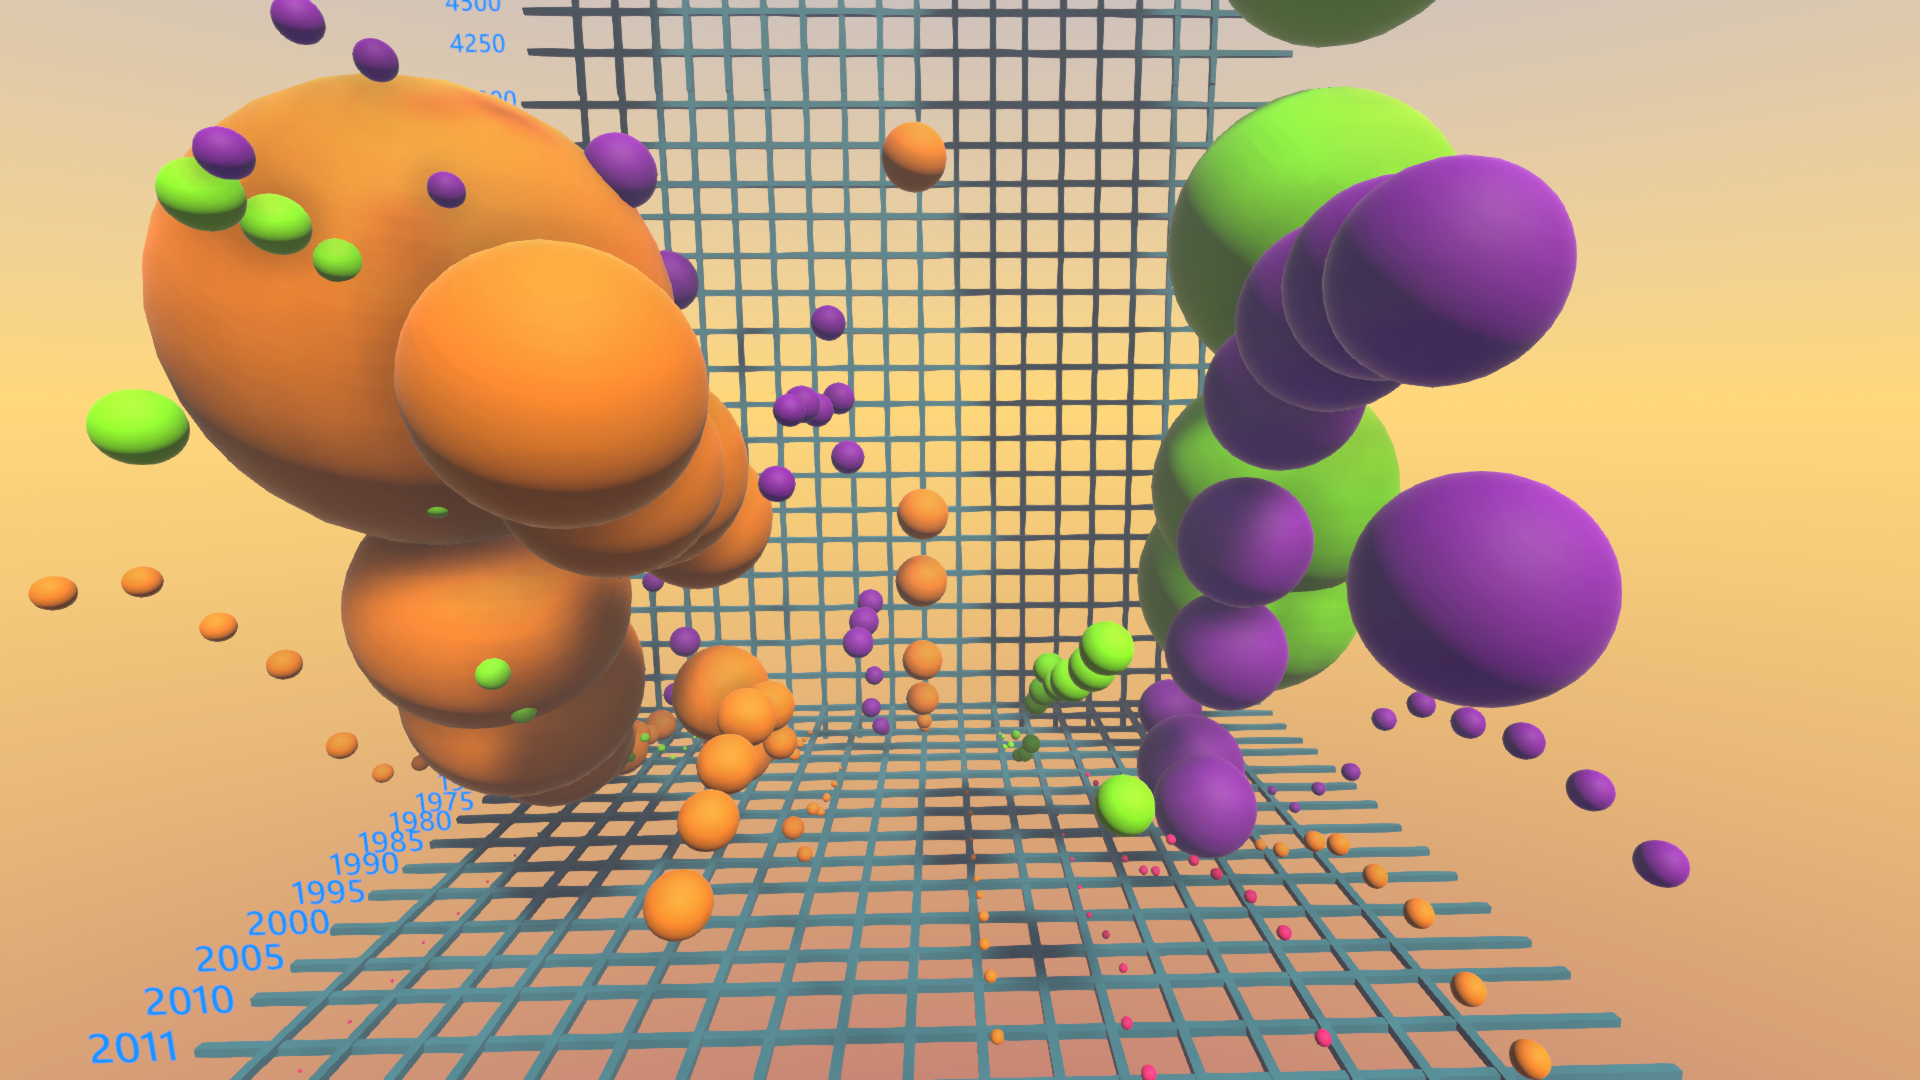
3D Data Visualization of CO2 emission per country per GDP per year. This graph demonstrate who we is contributing the most to climate change as well as who is actually reducing emissions. Selected only a few countries.
Page 1 / 1

3D Data Visualization of CO2 emission per country per GDP per year. This graph demonstrate who we is contributing the most to climate change as well as who is actually reducing emissions. Selected only a few countries.
Page 1 / 1