
Today we’re introducing AfterNow Viz, a new software product in our suite of AR and VR presentation tools.
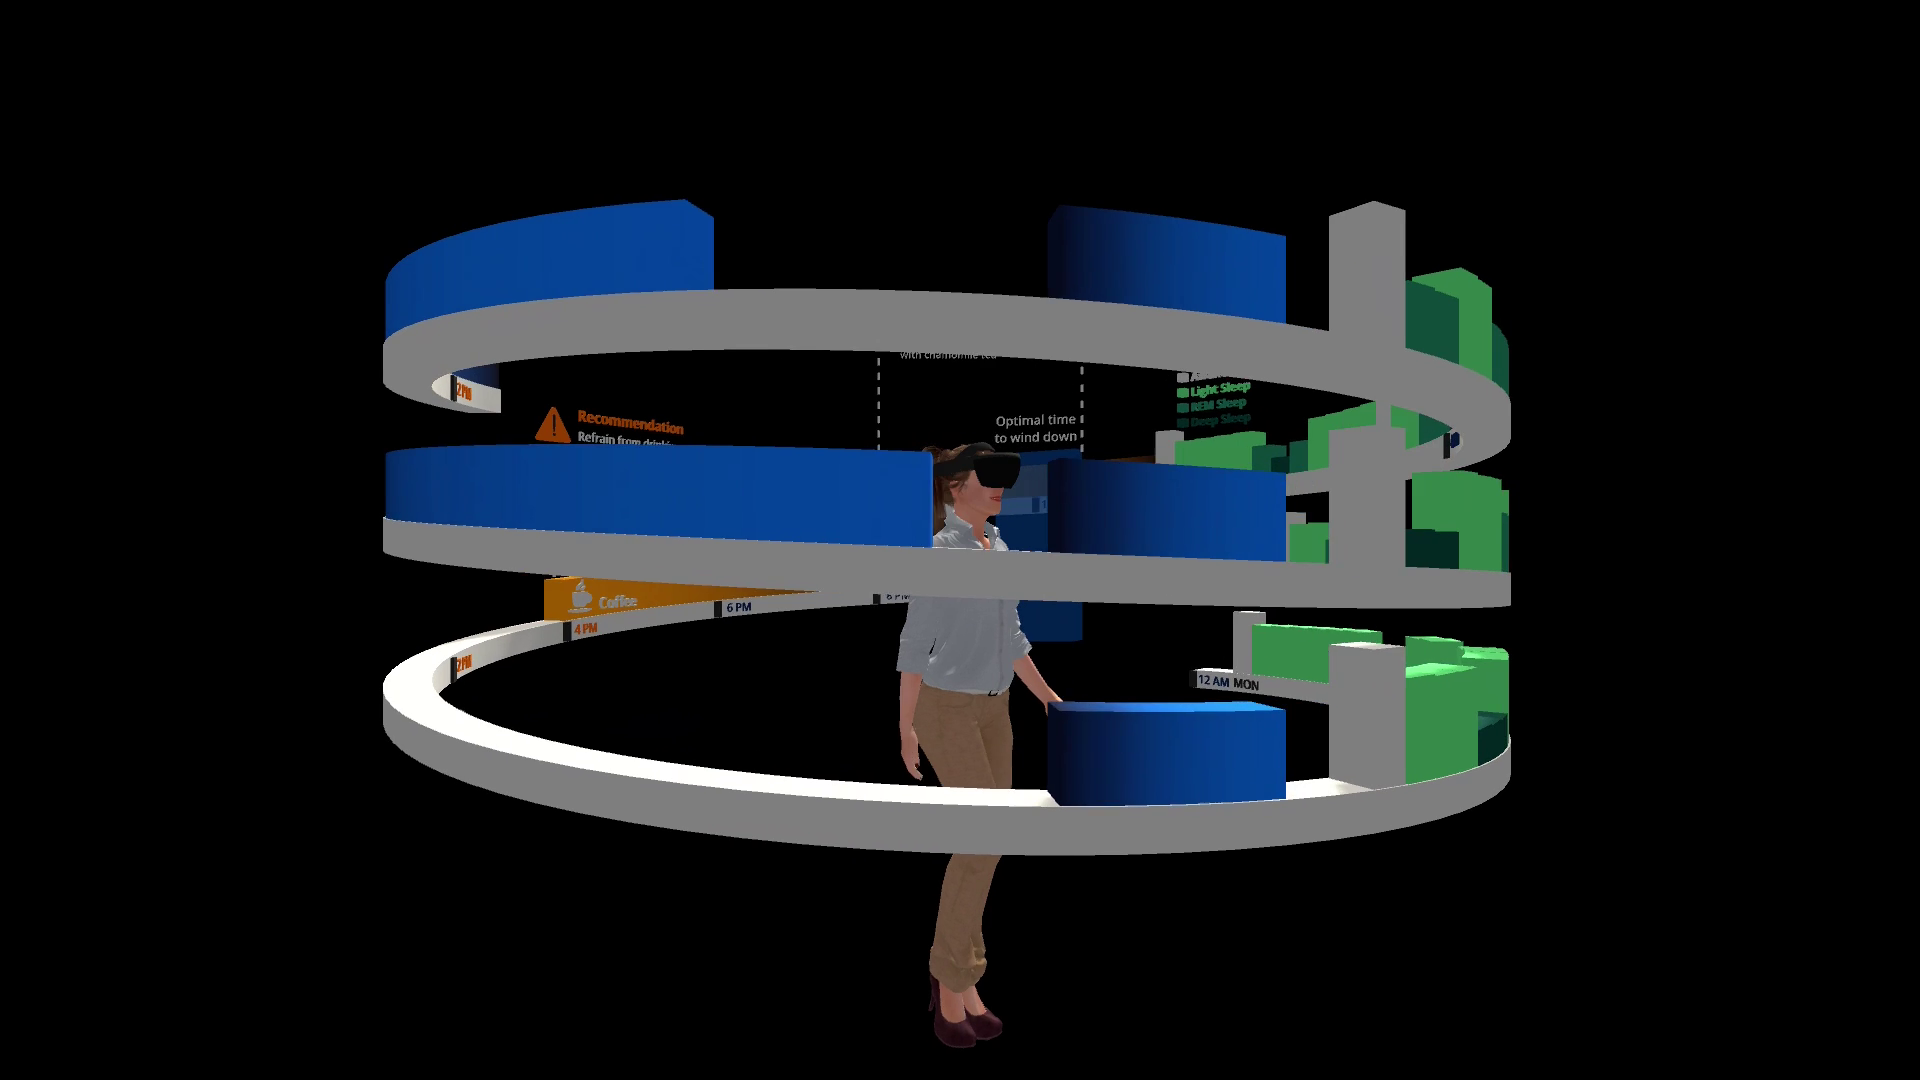
With augmented reality and virtual reality presentations, show your audience what data means in one simple 3D and interactive experience to deliver a winning communication strategy.
At the core of our digital transformation is data, enabling us to make unprecedented advances in machine learning, anthropology, science, geology, astronomy, chemistry, physics, and psychology, just to name a few.
It used to take entire rooms of machines to process the amount of data that our computers can now run in just a few minutes. It would take specialists years to become experts in data science, extracting meaningful insights from massive amounts of data, and then communicating it to the world.
Augmented reality and virtual reality take these complex and fascinating data modules and, with a single glance, make these insights accessible to everyone.
3D Presentations: A Winning Communication Strategy for Data Insights
Any presentation whether for sales, financial projections, inventory analysis, scientific research or product visualization is backed up with data.
For example, show customers the lifetime value of a car in comparison to competitor models. Or, create 3D financial projections that your customers can easily grasp for long-term investment planning. Demonstrate the results of a complex scientific study with 3D charts that are easy to understand in the context of scale and color.
Create visually compelling and interactive data experiences that leave a long-lasting impression for internal and external initiatives.
Use Cases
Take a moment to think about the amount of data you encounter each day, in your professional and personal life. Whether that’s charts and graphs in reports, to simple likes and share counts on social media profiles. These numbers are abstract on a 2D page, but imagine these as rich 3D data models that can empower data-driven decision-making.
The following are only a few examples of the infinite possibilities of 3D data visualization, and how it can be used to communicate with impact:
| Identify Trends for Long Term Planning | Aggregate Data for Decision Making | Develop Premium Reports for Clients and Executives | Evaluate Market Opportunities for Growth |
|---|---|---|---|
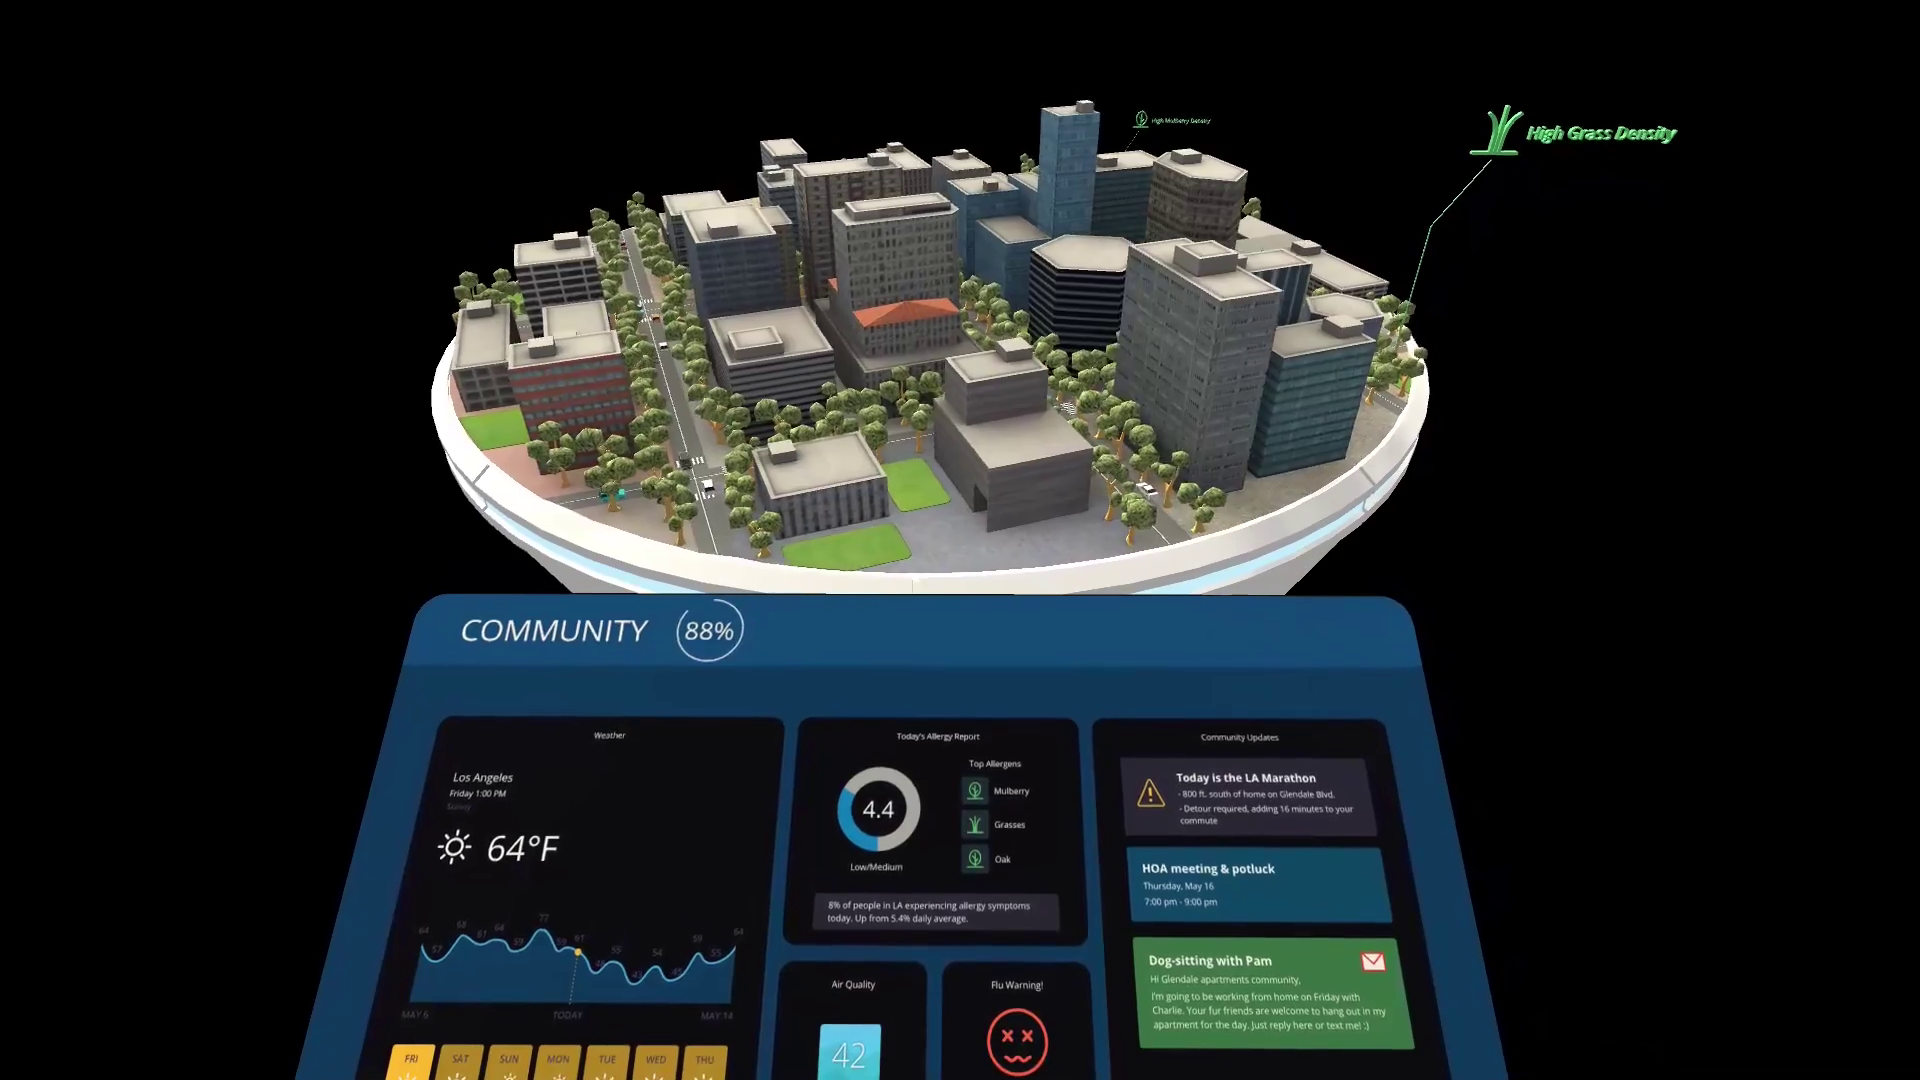
| Overlay data on 3D maps that demonstrate the scale of trends over a specific geographic area, or even the entire world. | Collate data from various sources, such as sales from multiple regions, and visualize this in the context of color and scale to understand market needs, business weaknesses and strengths. | Show your client and team the results of a campaign, research, or collaboration, visualizing the before and after impact, or the process of achieving key milestones and what this means with data. | Identify new market opportunities at a glance by importing market data over time or regions, and visualizing it in terms of scale and projections to make data-driven decisions. |
Data Visualization with Augmented Reality and Virtual Reality Drives Results
Augmented reality and virtual reality presentations bring context to content. Immerse your audience in a data-driven and interactive experience, enabling them to easily understand impact and scale, and connect with data in a meaningful and memorable way.
AR and VR data visualizations deliver high value, standing out from 2D content, strengthening emotional engagement, and recall. Create immersive and interactive environments for your clients or team, with personalized touches and deeper insights into business initiatives.
Our clients have closed multi-billion dollar deals with augmented reality and virtual reality presentations. Today’s audiences are multidimensional, and using 3D communication tools places your company at the cutting edge of digital strategy— a pathway to success.
User Interface: As Easy As Drag & Drop
AR and VR presentations are about making data-driven communication easy and accessible. Our interface is comparable to those such as Google Docs, and Microsoft Office.
In just a few easy steps, import your data in CSV into Viz, choose a template for the style of 3D data experience, and export the results into augmented reality and virtual reality.
From there, share your 3D data visualization with a simple access code for a guided or self-guided presentation.
Preview data on your mobile phone, then deploy to your audience using augmented reality or virtual reality devices.
Sign up for Early Access
Sign up for early access! We’ve been speaking closely with our customers, refining our data visualization software, and can’t wait to see what you make.
Need help developing your idea or delivering a bespoke presentation?
Don’t hesitate to contact us.